This passage describes some activities of the U.S. Department of Agriculture (USDA).
The U.S. Department of Agriculture Risk Management Agency oversees the Commodity Insurance program. This program offers farmers a variety of forms of insurance. One form is known as the Revenue Protection Plan. This plan protects farmers against losing income due to falling prices or crop failures.
Under this plan, a farmer may choose to purchase insurance to guarantee revenue of at least 75% of the Actual Production History of the farm. The insurance on some crops, such as corn, is subsidized by the federal government at a much higher rate than most other crops. The insurance rates vary depending on the type of crop grown.
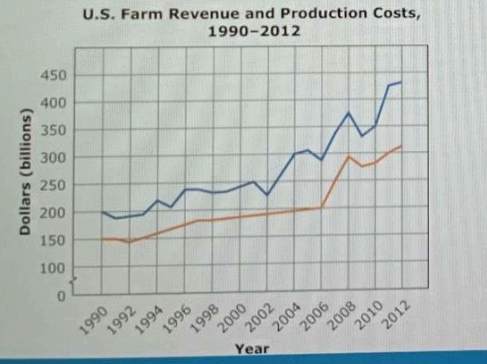
The USDA also has several agencies devoted to research. The Economic Research Service complies data about the total profits earned by U.S. farms. It measures the total income earned by farms and the total costs of production. Generally, both figures have increased over the past 10 years. This graph contains data from the U.S. Department of Agriculture.
Which prediction is supported by both graphs?
- A. The average wage for farm workers will decrease..
- B. The average cost for agricultural produce will decrease.
- C. The operating cost of running a farm will increase.
- D. The number of people required for producing food will increase.
Correct Answer & Rationale
Correct Answer: C
Option C is supported by both graphs, indicating an upward trend in operational costs due to factors like inflation and increased resource prices. This aligns with economic patterns observed in the agricultural sector. Option A is incorrect as both graphs do not show a decline in farm worker wages; rather, they suggest stability or growth. Option B is misleading; the graphs do not reflect a decrease in agricultural produce costs, which often correlate with rising operational expenses. Option D is also unsupported, as the data does not indicate an increase in labor requirements, but rather highlights efficiency improvements in farming practices.
Option C is supported by both graphs, indicating an upward trend in operational costs due to factors like inflation and increased resource prices. This aligns with economic patterns observed in the agricultural sector. Option A is incorrect as both graphs do not show a decline in farm worker wages; rather, they suggest stability or growth. Option B is misleading; the graphs do not reflect a decrease in agricultural produce costs, which often correlate with rising operational expenses. Option D is also unsupported, as the data does not indicate an increase in labor requirements, but rather highlights efficiency improvements in farming practices.
Other Related Questions
Which event occurred first?
- A. Michael moved to Ohio.
- B. Michael attained U.S. citizenship.
- C. The IRO was created.
- D. The UN was established.
Correct Answer & Rationale
Correct Answer: D
To determine the sequence of events, it’s essential to consider historical timelines. The United Nations (UN) was established in 1945, laying the groundwork for international cooperation. The International Refugee Organization (IRO) was created shortly after, in 1946, to address post-war refugee issues. Michael attaining U.S. citizenship likely occurred after these events, as it typically follows immigration processes. Lastly, Michael moving to Ohio would depend on his citizenship status and individual circumstances, making it the most recent event in this context.
To determine the sequence of events, it’s essential to consider historical timelines. The United Nations (UN) was established in 1945, laying the groundwork for international cooperation. The International Refugee Organization (IRO) was created shortly after, in 1946, to address post-war refugee issues. Michael attaining U.S. citizenship likely occurred after these events, as it typically follows immigration processes. Lastly, Michael moving to Ohio would depend on his citizenship status and individual circumstances, making it the most recent event in this context.
Which quotation from the excerpt reveals the author's bias about the relationship between the rule of the majority and the rights of the minority?
- A. "The wishes of the smaller group will override the wishes of the larger group and this will create resentment."
- B. "Requiring a unanimous vote or more than a majority vote is meant to provide a safeguard against oppression."
- C. "In these circumstances, expect constant scheming, trickery, and tiresome delays, resulting in disgraceful deals that violate the public good."
- D. "In times of national emergency, the goodness, badness, weakness, and strength of the government is supremely important."
Correct Answer & Rationale
Correct Answer: C
Option C highlights the author's bias by suggesting that the majority's decisions can lead to unethical behavior that undermines public welfare. This reveals a concern for minority rights, indicating that the author believes majority rule may result in negative consequences for those not in power. Option A misrepresents the author's view, as it suggests that the smaller group's wishes will always be overridden, which does not directly reflect bias against majority rule. Option B focuses on safeguards against oppression, which does not convey bias but rather a protective measure. Option D addresses the government's performance during emergencies but fails to connect to the relationship between majority rule and minority rights, missing the core issue of bias.
Option C highlights the author's bias by suggesting that the majority's decisions can lead to unethical behavior that undermines public welfare. This reveals a concern for minority rights, indicating that the author believes majority rule may result in negative consequences for those not in power. Option A misrepresents the author's view, as it suggests that the smaller group's wishes will always be overridden, which does not directly reflect bias against majority rule. Option B focuses on safeguards against oppression, which does not convey bias but rather a protective measure. Option D addresses the government's performance during emergencies but fails to connect to the relationship between majority rule and minority rights, missing the core issue of bias.
Based on the excerpt, which conclusion can be drawn about the U.S. Constitution and the Bill of Rights?
- A. Ratification of the Bill of Rights was completed before the Constitution was drafted.
- B. Ratification of the Constitution was dependent on the passage of the Bill of Rights.
- C. Most leaders were worried that the Bill of Rights would weaken the ruling class protected by the Constitution.
- D. Many leaders were concerned that the Bill of Rights would upset the balance of powers outlined in the Constitution.
Correct Answer & Rationale
Correct Answer: B
The conclusion that ratification of the Constitution was dependent on the passage of the Bill of Rights is supported by historical context, as many states required assurance of individual rights to approve the Constitution. Option A is incorrect because the Bill of Rights was introduced after the Constitution was drafted. Option C misrepresents the intent of the Bill of Rights; leaders were primarily concerned with protecting individual liberties rather than preserving the ruling class. Option D is also inaccurate, as the Bill of Rights aimed to safeguard citizens' rights without disrupting the balance of powers established by the Constitution.
The conclusion that ratification of the Constitution was dependent on the passage of the Bill of Rights is supported by historical context, as many states required assurance of individual rights to approve the Constitution. Option A is incorrect because the Bill of Rights was introduced after the Constitution was drafted. Option C misrepresents the intent of the Bill of Rights; leaders were primarily concerned with protecting individual liberties rather than preserving the ruling class. Option D is also inaccurate, as the Bill of Rights aimed to safeguard citizens' rights without disrupting the balance of powers established by the Constitution.
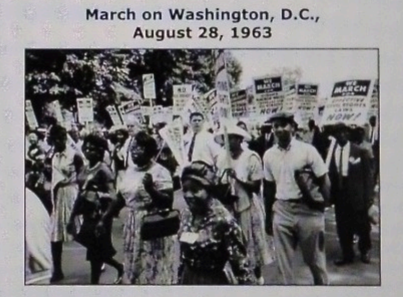
Which statement best describes the action of the people in the photograph?
- A. They are utilizing an 8th Amendment right to secure the release of a colleague who was jailed unfairly.
- B. They are utilizing a 6th Amendment right to secure a fair trial for a jailed associate.
- C. They are utilizing a 1st Amendment right to secure equality under the law.
- D. They are utilizing a 14th Amendment right to secure the opportunity to vote in federal elections.
Correct Answer & Rationale
Correct Answer: C
The action depicted in the photograph aligns with the 1st Amendment, which guarantees freedoms concerning speech, assembly, and the right to petition the government. The individuals are likely advocating for equality under the law, a fundamental principle of democratic society. Option A incorrectly references the 8th Amendment, which focuses on protection against excessive bail and cruel punishment, not the right to protest for a colleague's release. Option B misapplies the 6th Amendment, which ensures the right to a fair trial, rather than addressing broader issues of equality. Option D inaccurately connects the situation to the 14th Amendment, which deals with citizenship rights and equal protection, not specifically voting rights.
The action depicted in the photograph aligns with the 1st Amendment, which guarantees freedoms concerning speech, assembly, and the right to petition the government. The individuals are likely advocating for equality under the law, a fundamental principle of democratic society. Option A incorrectly references the 8th Amendment, which focuses on protection against excessive bail and cruel punishment, not the right to protest for a colleague's release. Option B misapplies the 6th Amendment, which ensures the right to a fair trial, rather than addressing broader issues of equality. Option D inaccurately connects the situation to the 14th Amendment, which deals with citizenship rights and equal protection, not specifically voting rights.