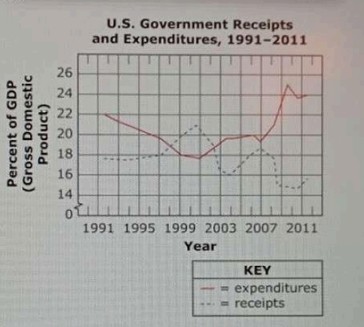
The data in the graph is from the U.S. Department of Commerce.
According to this graph, in which year did the U.S. government first achieve a budget surplus?
- A. 1996
- B. 1994
- C. 1998
- D. 2002
Correct Answer & Rationale
Correct Answer: C
The graph indicates that the U.S. government first achieved a budget surplus in 1998, as evidenced by the line crossing above the zero mark in that year. Option A (1996) shows a deficit, as the line remains below zero. Option B (1994) also reflects a deficit, indicating that the government had not yet balanced its budget. Option D (2002) is incorrect as it depicts a return to deficit after a surplus, confirming that the surplus was achieved earlier in 1998. Thus, 1998 is the first year when the budget surplus was realized.
The graph indicates that the U.S. government first achieved a budget surplus in 1998, as evidenced by the line crossing above the zero mark in that year. Option A (1996) shows a deficit, as the line remains below zero. Option B (1994) also reflects a deficit, indicating that the government had not yet balanced its budget. Option D (2002) is incorrect as it depicts a return to deficit after a surplus, confirming that the surplus was achieved earlier in 1998. Thus, 1998 is the first year when the budget surplus was realized.
Other Related Questions
How does the U.S. Supreme Court's ruling differ from Justice Murphy's dissent?
- A. Only Justice Murphy's dissent acknowledged the dangers to the United States of having citizens from foreign lands.
- B. Only the Court's ruling acknowledged that the actions of fearful U.S. authorities can endanger the civil rights of citizens.
- C. Only the Court's ruling contended that Korematsu was ordered held in an internment camp because he was disloyal to the United States during time of war.
- D. Only Justice Murphy's dissent contended that U.S. internment camps were a clear-cut example of racial prejudice.
Correct Answer & Rationale
Correct Answer: D
Justice Murphy's dissent emphasized that the internment camps represented blatant racial prejudice, highlighting the unjust targeting of Japanese Americans based solely on their ethnicity. This perspective contrasts sharply with the majority opinion, which focused on national security concerns without addressing the racial implications. Option A is incorrect as both perspectives recognize the potential dangers of foreign nationals, albeit in different contexts. Option B misrepresents the majority's stance, which did not explicitly acknowledge civil rights violations. Option C inaccurately simplifies the Court's ruling, which did not solely attribute internment to disloyalty.
Justice Murphy's dissent emphasized that the internment camps represented blatant racial prejudice, highlighting the unjust targeting of Japanese Americans based solely on their ethnicity. This perspective contrasts sharply with the majority opinion, which focused on national security concerns without addressing the racial implications. Option A is incorrect as both perspectives recognize the potential dangers of foreign nationals, albeit in different contexts. Option B misrepresents the majority's stance, which did not explicitly acknowledge civil rights violations. Option C inaccurately simplifies the Court's ruling, which did not solely attribute internment to disloyalty.
Which sentence from the passage provides evidence that the Veterans Administration was involved in the development of suburban communities?
- A. "Men returned home from military service, got married, and started families." (paragraph 1)
- B. "Moreover, a separate government program made low-interest mortgage loans available to returning military personnel." (paragraph 4)
- C. "Even so, the success of Levittown depended not only on the efficiency of the Levitt brothers' process but also on the Federal Housing Administration, which guaranteed bank loans to builders." (paragraph 4)
- D. "William and his brother Alfred first gained experience in assembly-line techniques while building government housing for defense workers during World War II." (paragraph 2)
Correct Answer & Rationale
Correct Answer: B
Option B clearly highlights the involvement of the Veterans Administration by mentioning a specific government program that provided low-interest mortgage loans to returning military personnel. This directly links the agency's actions to the development of suburban communities, as affordable housing financing is crucial for homeownership. Option A discusses the general trend of returning veterans starting families but does not specifically reference the Veterans Administration's role. Option C mentions the Federal Housing Administration, not the Veterans Administration, which makes it irrelevant to the question. Option D focuses on the Levitt brothers’ prior experience and does not address the Veterans Administration's involvement in suburban development.
Option B clearly highlights the involvement of the Veterans Administration by mentioning a specific government program that provided low-interest mortgage loans to returning military personnel. This directly links the agency's actions to the development of suburban communities, as affordable housing financing is crucial for homeownership. Option A discusses the general trend of returning veterans starting families but does not specifically reference the Veterans Administration's role. Option C mentions the Federal Housing Administration, not the Veterans Administration, which makes it irrelevant to the question. Option D focuses on the Levitt brothers’ prior experience and does not address the Veterans Administration's involvement in suburban development.
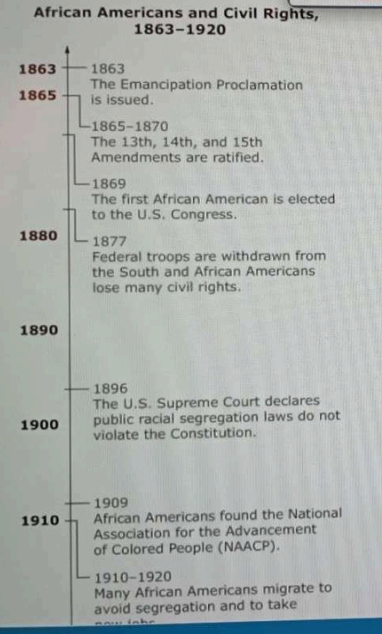
Based on the timeline and the map, what was one way African Americans dealt with Jim Crow laws?
- A. by taking service jobs in southern cities
- B. by seeking factory jobs in urban areas of the North
- C. by becoming tenant farmers in other parts of the South
- D. by gaining technical skills in northern schools
Correct Answer & Rationale
Correct Answer: B
African Americans responded to Jim Crow laws by seeking factory jobs in urban areas of the North, as this migration offered better economic opportunities and a chance to escape oppressive conditions in the South. Option A, taking service jobs in southern cities, often perpetuated the same discriminatory practices found under Jim Crow. Option C, becoming tenant farmers in other parts of the South, did not provide significant relief from the systemic racism and economic hardship prevalent in that region. Option D, gaining technical skills in northern schools, while beneficial, was not a widespread or immediate solution compared to the mass migration to northern factories.
African Americans responded to Jim Crow laws by seeking factory jobs in urban areas of the North, as this migration offered better economic opportunities and a chance to escape oppressive conditions in the South. Option A, taking service jobs in southern cities, often perpetuated the same discriminatory practices found under Jim Crow. Option C, becoming tenant farmers in other parts of the South, did not provide significant relief from the systemic racism and economic hardship prevalent in that region. Option D, gaining technical skills in northern schools, while beneficial, was not a widespread or immediate solution compared to the mass migration to northern factories.
Which statement identifies a purpose of Roosevelt's speech?
- A. to convince his audience that preserving the environment is as important as national security
- B. to convince his audience that preserving the environment is the responsibility of ordinary citizens
- C. to gain support for using public lands to obtain vital productive resources
- D. to gain support for a candidate who wants to preserve the environment
Correct Answer & Rationale
Correct Answer: A
Option A effectively captures Roosevelt's emphasis on the interconnectedness of environmental preservation and national security. He aimed to highlight that a healthy environment is crucial for the nation's well-being and stability. Option B is incorrect as Roosevelt’s speech focuses more on broader national priorities rather than individual responsibilities. Option C misinterprets the message; while resource management is important, the speech primarily advocates for environmental preservation rather than exploitation. Option D is misleading; Roosevelt's speech is not about promoting a candidate but rather advocating for a national commitment to environmental stewardship.
Option A effectively captures Roosevelt's emphasis on the interconnectedness of environmental preservation and national security. He aimed to highlight that a healthy environment is crucial for the nation's well-being and stability. Option B is incorrect as Roosevelt’s speech focuses more on broader national priorities rather than individual responsibilities. Option C misinterprets the message; while resource management is important, the speech primarily advocates for environmental preservation rather than exploitation. Option D is misleading; Roosevelt's speech is not about promoting a candidate but rather advocating for a national commitment to environmental stewardship.