Which conclusion can be drawn from the diagrams?
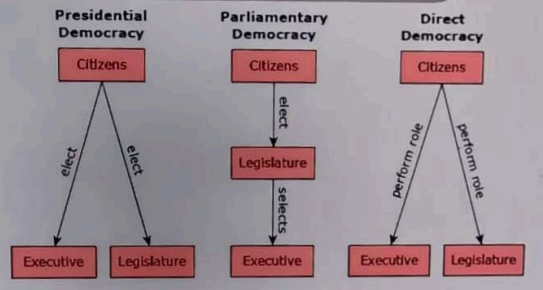
- A. The legislature is more representative of the people in a presidential democracy than in a parliamentary democracy.
- B. The branches of government are more independent of each other in a presidential democracy than in a parliamentary democracy.
- C. The executive branch is more accountable to the people in a parliamentary democracy than in a direct democracy.
- D. The people are more involved in governing in a presidential democracy than in a direct democracy.
Correct Answer & Rationale
Correct Answer: B
In a presidential democracy, the separation of powers is a key feature, allowing the executive, legislative, and judicial branches to operate independently. This independence enhances checks and balances, ensuring that no single branch can dominate. Option A is incorrect as both systems aim for representation, but the degree can vary based on specific contexts rather than the type of democracy. Option C misrepresents accountability; in parliamentary systems, the executive is directly accountable to the legislature, which is elected by the people. Option D is misleading; in a direct democracy, citizens have direct involvement in governance, often more so than in a presidential system.
In a presidential democracy, the separation of powers is a key feature, allowing the executive, legislative, and judicial branches to operate independently. This independence enhances checks and balances, ensuring that no single branch can dominate. Option A is incorrect as both systems aim for representation, but the degree can vary based on specific contexts rather than the type of democracy. Option C misrepresents accountability; in parliamentary systems, the executive is directly accountable to the legislature, which is elected by the people. Option D is misleading; in a direct democracy, citizens have direct involvement in governance, often more so than in a presidential system.
Other Related Questions
Based on the flowchart, how is a political party's presidential candidate selected?
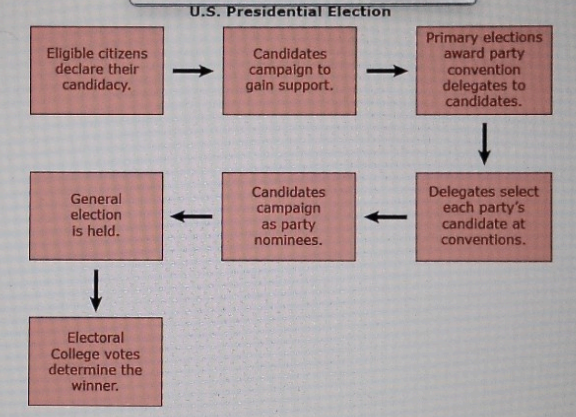
- A. by balloting after the general election
- B. by balloting at the party convention
- C. by votes cast in party primary elections
- D. by votes cast in the general election
Correct Answer & Rationale
Correct Answer: C
The selection of a political party's presidential candidate primarily occurs through votes cast in party primary elections. This process allows party members to express their preferences for candidates before the general election, ensuring that the nominee reflects the party's values and priorities. Option A is incorrect because the general election occurs after the candidate has already been chosen. Option B, while related to the convention, is misleading as the convention typically formalizes the candidate chosen in the primaries rather than selecting them. Option D is also incorrect, as the general election determines the overall winner, not the party's candidate.
The selection of a political party's presidential candidate primarily occurs through votes cast in party primary elections. This process allows party members to express their preferences for candidates before the general election, ensuring that the nominee reflects the party's values and priorities. Option A is incorrect because the general election occurs after the candidate has already been chosen. Option B, while related to the convention, is misleading as the convention typically formalizes the candidate chosen in the primaries rather than selecting them. Option D is also incorrect, as the general election determines the overall winner, not the party's candidate.
How did Chief Justice Marshall contribute to the U.S. government system of checks and balances?
- A. by establishing the Supreme Court's power to check Congress
- B. by creating the power to remove the president from office
- C. by expanding the president's power to check Congress
- D. by giving the Supreme Court the power to control itself
Correct Answer & Rationale
Correct Answer: A
Chief Justice Marshall played a pivotal role in defining the Supreme Court's authority, notably through the landmark case Marbury v. Madison, which established the principle of judicial review. This empowered the Court to invalidate laws passed by Congress that it deemed unconstitutional, effectively allowing it to check legislative power. Option B is incorrect as the power to remove a president lies with Congress through impeachment, not the Supreme Court. Option C misrepresents Marshall's contributions, as he did not expand presidential power but rather clarified judicial authority. Option D is also inaccurate; the Supreme Court does not have self-regulating powers but operates within the framework of checks and balances.
Chief Justice Marshall played a pivotal role in defining the Supreme Court's authority, notably through the landmark case Marbury v. Madison, which established the principle of judicial review. This empowered the Court to invalidate laws passed by Congress that it deemed unconstitutional, effectively allowing it to check legislative power. Option B is incorrect as the power to remove a president lies with Congress through impeachment, not the Supreme Court. Option C misrepresents Marshall's contributions, as he did not expand presidential power but rather clarified judicial authority. Option D is also inaccurate; the Supreme Court does not have self-regulating powers but operates within the framework of checks and balances.
How does the message presented by Senator Paul differ from the message presented by President Obama?
- A. Only Senator Paul promotes less government involvement in health care.
- B. Only Senator Paul wants to secure more health care for U.S. citizens.
- C. Only President Obama supports the Supreme Court's right to rule about health care.
- D. Only President Obama discusses problems in the health care industry.
Correct Answer & Rationale
Correct Answer: A
Senator Paul advocates for reduced government involvement in health care, emphasizing personal choice and market-driven solutions. This contrasts with President Obama's approach, which supports a more active role for the government in expanding access and regulating the industry. Option B is incorrect as both politicians aim to improve health care access, albeit through different methods. Option C misrepresents Obama's stance; he supports health care reforms that align with Supreme Court rulings but does not solely focus on this aspect. Option D is misleading; while Obama addresses health care issues, Senator Paul also discusses industry challenges, making this option inaccurate.
Senator Paul advocates for reduced government involvement in health care, emphasizing personal choice and market-driven solutions. This contrasts with President Obama's approach, which supports a more active role for the government in expanding access and regulating the industry. Option B is incorrect as both politicians aim to improve health care access, albeit through different methods. Option C misrepresents Obama's stance; he supports health care reforms that align with Supreme Court rulings but does not solely focus on this aspect. Option D is misleading; while Obama addresses health care issues, Senator Paul also discusses industry challenges, making this option inaccurate.
Which technology mentioned in the passage was the first one invented by Edison?
- A. vote recorder
- B. motion-picture camera
- C. electric light bulb
- D. phonograph
Correct Answer & Rationale
Correct Answer: A
The vote recorder was the first technology invented by Edison, designed to streamline the voting process. This innovation predates his more famous inventions. The motion-picture camera (B) and electric light bulb (C) came later, showcasing Edison's evolution as an inventor. The phonograph (D), although significant in audio technology, was also developed after the vote recorder. Understanding the chronological order of these inventions highlights Edison's early contributions to technology and their impact on society.
The vote recorder was the first technology invented by Edison, designed to streamline the voting process. This innovation predates his more famous inventions. The motion-picture camera (B) and electric light bulb (C) came later, showcasing Edison's evolution as an inventor. The phonograph (D), although significant in audio technology, was also developed after the vote recorder. Understanding the chronological order of these inventions highlights Edison's early contributions to technology and their impact on society.