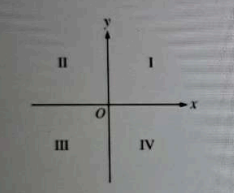
The x-and y- coordinates of point P are each to be chosen at random from the set of integers 1 through 10. What is the probability that P will be in quadrant II?
- B. 01-Oct
- C. 01-Apr
- D. 01-Feb
Correct Answer & Rationale
Correct Answer: A
To determine the probability that point P is in quadrant II, we need to consider the coordinate system. In quadrant II, the x-coordinate must be negative, and the y-coordinate must be positive. However, since the x-coordinates are chosen from the integers 1 through 10, all possible x-values are positive. This means point P cannot be in quadrant II, making the probability 0. Option A correctly reflects this conclusion with a probability of 0. Options B, C, and D suggest specific dates, which are irrelevant to the question and do not address the coordinate conditions necessary for quadrant II. Thus, they are incorrect.
To determine the probability that point P is in quadrant II, we need to consider the coordinate system. In quadrant II, the x-coordinate must be negative, and the y-coordinate must be positive. However, since the x-coordinates are chosen from the integers 1 through 10, all possible x-values are positive. This means point P cannot be in quadrant II, making the probability 0. Option A correctly reflects this conclusion with a probability of 0. Options B, C, and D suggest specific dates, which are irrelevant to the question and do not address the coordinate conditions necessary for quadrant II. Thus, they are incorrect.
Other Related Questions
3√2- 2/(√2) =
- A. 2√2
- B. √2
- C. 3
- D. 4
Correct Answer & Rationale
Correct Answer: A
To solve the expression \( 3\sqrt{2} - \frac{2}{\sqrt{2}} \), we first simplify \( \frac{2}{\sqrt{2}} \). This can be rewritten as \( \frac{2\sqrt{2}}{2} = \sqrt{2} \). Thus, the expression becomes \( 3\sqrt{2} - \sqrt{2} \), which simplifies to \( 2\sqrt{2} \). Option B (\( \sqrt{2} \)) is incorrect as it does not account for the subtraction from \( 3\sqrt{2} \). Option C (3) is incorrect because it misrepresents the value obtained after simplification. Option D (4) is also incorrect, as it does not relate to the expression at all.
To solve the expression \( 3\sqrt{2} - \frac{2}{\sqrt{2}} \), we first simplify \( \frac{2}{\sqrt{2}} \). This can be rewritten as \( \frac{2\sqrt{2}}{2} = \sqrt{2} \). Thus, the expression becomes \( 3\sqrt{2} - \sqrt{2} \), which simplifies to \( 2\sqrt{2} \). Option B (\( \sqrt{2} \)) is incorrect as it does not account for the subtraction from \( 3\sqrt{2} \). Option C (3) is incorrect because it misrepresents the value obtained after simplification. Option D (4) is also incorrect, as it does not relate to the expression at all.
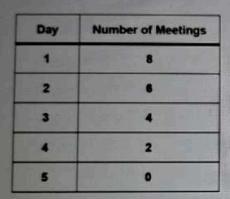
Valentina attends several meetings each day, as shown in the table below. Which of the following describes this pattern?
- A. The number of meetings increases by the same amount each day.
- B. The number of meetings decreases by the same amount each day.
- C. Each day, the number of meetings increases by the same percent over the previous day's number of meetings.
- D. Each day, the number of meetings decreases by the same percent over the previous day's number of meetings.
Correct Answer & Rationale
Correct Answer: C
The pattern of Valentina's meetings indicates that the number of meetings increases by a consistent percentage each day, reflecting exponential growth. This is evident when comparing the daily totals, which show a proportional rise rather than a fixed increase. Option A is incorrect because it suggests a linear growth, where the same number of meetings is added daily, which is not observed. Option B implies a consistent decrease, which contradicts the observed increase in meetings. Option D also misrepresents the data by suggesting a percentage decrease, which does not align with the trend of increasing meetings.
The pattern of Valentina's meetings indicates that the number of meetings increases by a consistent percentage each day, reflecting exponential growth. This is evident when comparing the daily totals, which show a proportional rise rather than a fixed increase. Option A is incorrect because it suggests a linear growth, where the same number of meetings is added daily, which is not observed. Option B implies a consistent decrease, which contradicts the observed increase in meetings. Option D also misrepresents the data by suggesting a percentage decrease, which does not align with the trend of increasing meetings.
If |x|+|y| = 4 and x ≠y, then x CANNOT be equal to
- A. 2
- C. -2
- D. -5
Correct Answer & Rationale
Correct Answer: D
The equation |x| + |y| = 4 defines a diamond-shaped region in the coordinate plane, where the sum of the absolute values of x and y equals 4. Option A (2) is possible since |2| + |y| = 4 allows y to be 2 or -2. Option C (-2) is also valid, as |-2| + |y| = 4 permits y to be 2 or -2. Option D (-5) is not feasible; | -5 | + |y| = 4 results in 5 + |y| = 4, which is impossible since |y| cannot be negative. Thus, -5 cannot satisfy the given equation while ensuring x ≠ y.
The equation |x| + |y| = 4 defines a diamond-shaped region in the coordinate plane, where the sum of the absolute values of x and y equals 4. Option A (2) is possible since |2| + |y| = 4 allows y to be 2 or -2. Option C (-2) is also valid, as |-2| + |y| = 4 permits y to be 2 or -2. Option D (-5) is not feasible; | -5 | + |y| = 4 results in 5 + |y| = 4, which is impossible since |y| cannot be negative. Thus, -5 cannot satisfy the given equation while ensuring x ≠ y.
If the length of a rectangle is increased by 30% and the width of the same rectangle is decreased by 30%, what is the effect on the area of the rectangle?
- A. It is increased by 60%.
- B. It is unchanged.
- C. It is decreased by 15%.
- D. It is decreased by 9%.
Correct Answer & Rationale
Correct Answer: D
Increasing the length of a rectangle by 30% results in a new length of 1.3L, while decreasing the width by 30% gives a new width of 0.7W. The new area can be calculated as A' = (1.3L)(0.7W) = 0.91LW, indicating a decrease in area. Option A is incorrect because a 60% increase does not occur; the area actually decreases. Option B is wrong as the area changes due to the modifications in dimensions. Option C suggests a decrease of 15%, which miscalculates the area change. The area decreases by 9%, confirming the effect of the opposing percentage changes in length and width.
Increasing the length of a rectangle by 30% results in a new length of 1.3L, while decreasing the width by 30% gives a new width of 0.7W. The new area can be calculated as A' = (1.3L)(0.7W) = 0.91LW, indicating a decrease in area. Option A is incorrect because a 60% increase does not occur; the area actually decreases. Option B is wrong as the area changes due to the modifications in dimensions. Option C suggests a decrease of 15%, which miscalculates the area change. The area decreases by 9%, confirming the effect of the opposing percentage changes in length and width.