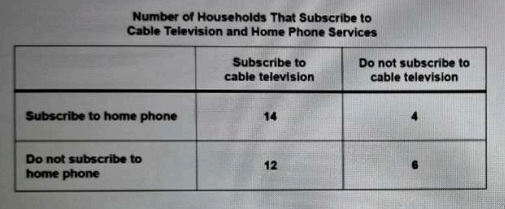
Malia collected information about whether the members of the 36 households on her block subscribed to cable television and home phone services. Her results are shown in the table below.\nIf a household on Malia's block is selected at random and does subscribe to cable television, what is the probability the members of the household also subscribe to home phone service?
- A. 14/18
- B. 14/26
- C. 18/36
- D. 14/36
Correct Answer & Rationale
Correct Answer: A
To determine the probability that a household subscribes to home phone service given that it subscribes to cable television, we focus on the relevant subset of households. Malia found 18 households that subscribe to cable, out of which 14 also subscribe to home phone service. Thus, the probability is calculated as the number of households with both services (14) divided by the total number of households with cable (18), resulting in 14/18. Option B (14/26) incorrectly uses the total number of households with home phone service instead of just those with cable. Option C (18/36) misinterprets the probability as a ratio of all households rather than those who subscribe to cable. Option D (14/36) inaccurately represents the total number of households instead of focusing on the cable subscribers.
To determine the probability that a household subscribes to home phone service given that it subscribes to cable television, we focus on the relevant subset of households. Malia found 18 households that subscribe to cable, out of which 14 also subscribe to home phone service. Thus, the probability is calculated as the number of households with both services (14) divided by the total number of households with cable (18), resulting in 14/18. Option B (14/26) incorrectly uses the total number of households with home phone service instead of just those with cable. Option C (18/36) misinterprets the probability as a ratio of all households rather than those who subscribe to cable. Option D (14/36) inaccurately represents the total number of households instead of focusing on the cable subscribers.
Other Related Questions
Square S has area 2√2 square units. What is the length of a side of square S?
- A. ∜128
- B. ∜32
- C. ∜8
- D. ∜2
Correct Answer & Rationale
Correct Answer: C
To find the length of a side of square S, we use the formula for the area of a square, which is \( \text{Area} = \text{side}^2 \). Given that the area is \( 2\sqrt{2} \), we set up the equation \( \text{side}^2 = 2\sqrt{2} \). Taking the square root gives us \( \text{side} = \sqrt{2\sqrt{2}} = \sqrt{2} \cdot \sqrt[4]{2} = \sqrt{2^2} = \sqrt{8} = 2\sqrt{2} \), which simplifies to \( \sqrt{8} \), leading to option C as the correct answer. Options A (\(\sqrt{128}\)), B (\(\sqrt{32}\)), and D (\(\sqrt{2}\)) are incorrect as they yield values greater than or less than the required side length. Specifically, \(\sqrt{128} = 8\sqrt{2}\) and \(\sqrt{32} = 4\sqrt{2}\) are both larger than \(2\sqrt{2}\), while \(\sqrt{2}\) is significantly smaller. Thus, option C accurately represents the side length of square S.
To find the length of a side of square S, we use the formula for the area of a square, which is \( \text{Area} = \text{side}^2 \). Given that the area is \( 2\sqrt{2} \), we set up the equation \( \text{side}^2 = 2\sqrt{2} \). Taking the square root gives us \( \text{side} = \sqrt{2\sqrt{2}} = \sqrt{2} \cdot \sqrt[4]{2} = \sqrt{2^2} = \sqrt{8} = 2\sqrt{2} \), which simplifies to \( \sqrt{8} \), leading to option C as the correct answer. Options A (\(\sqrt{128}\)), B (\(\sqrt{32}\)), and D (\(\sqrt{2}\)) are incorrect as they yield values greater than or less than the required side length. Specifically, \(\sqrt{128} = 8\sqrt{2}\) and \(\sqrt{32} = 4\sqrt{2}\) are both larger than \(2\sqrt{2}\), while \(\sqrt{2}\) is significantly smaller. Thus, option C accurately represents the side length of square S.
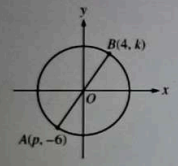
In the xy-plane above, the circle has center (0, 0) and AB is a diameter of the circle. What is the equation of the line passing through points A and B?
- A. y=-2/3 x
- B. y=2/3 x
- C. y=3/2 x
- D. y=4x
Correct Answer & Rationale
Correct Answer: B
The line passing through points A and B, which are endpoints of a diameter of the circle centered at (0, 0), must be a straight line that passes through the origin. Option B, \(y = \frac{2}{3}x\), represents a line with a positive slope, indicating that as x increases, y also increases, which is consistent with the properties of a diameter. Option A, \(y = -\frac{2}{3}x\), has a negative slope, suggesting a downward trend, which does not align with the upward direction of a diameter in the first quadrant. Option C, \(y = \frac{3}{2}x\), has a steeper slope than option B, which may not accurately represent the diameter's angle unless specified. Option D, \(y = 4x\), has an even steeper slope, making it unlikely to be the diameter unless A and B are positioned at extreme angles, which is not given in the problem.
The line passing through points A and B, which are endpoints of a diameter of the circle centered at (0, 0), must be a straight line that passes through the origin. Option B, \(y = \frac{2}{3}x\), represents a line with a positive slope, indicating that as x increases, y also increases, which is consistent with the properties of a diameter. Option A, \(y = -\frac{2}{3}x\), has a negative slope, suggesting a downward trend, which does not align with the upward direction of a diameter in the first quadrant. Option C, \(y = \frac{3}{2}x\), has a steeper slope than option B, which may not accurately represent the diameter's angle unless specified. Option D, \(y = 4x\), has an even steeper slope, making it unlikely to be the diameter unless A and B are positioned at extreme angles, which is not given in the problem.
0.034÷(10)^(-1) =
- A. 0.0034
- B. 0.034
- C. 0.34
- D. 3.4
Correct Answer & Rationale
Correct Answer: C
To solve 0.034 ÷ (10)^(-1), we first recognize that (10)^(-1) is equivalent to 1/10 or 0.1. Dividing by 0.1 is the same as multiplying by 10. Therefore, 0.034 ÷ 0.1 equals 0.034 × 10, which results in 0.34. Option A (0.0034) misinterprets the division, mistakenly moving the decimal too far left. Option B (0.034) fails to account for the division by 0.1, leaving the original number unchanged. Option D (3.4) incorrectly multiplies instead of dividing, moving the decimal point too far right. Thus, the only accurate calculation leads to 0.34.
To solve 0.034 ÷ (10)^(-1), we first recognize that (10)^(-1) is equivalent to 1/10 or 0.1. Dividing by 0.1 is the same as multiplying by 10. Therefore, 0.034 ÷ 0.1 equals 0.034 × 10, which results in 0.34. Option A (0.0034) misinterprets the division, mistakenly moving the decimal too far left. Option B (0.034) fails to account for the division by 0.1, leaving the original number unchanged. Option D (3.4) incorrectly multiplies instead of dividing, moving the decimal point too far right. Thus, the only accurate calculation leads to 0.34.
Each of the following is a solution to the equation x- 2y = 4 EXCEPT
- A. (-2,-3)
- B. (0,2)
- C. (4,0)
- D. (8,2)
Correct Answer & Rationale
Correct Answer: B
To determine which option is not a solution to the equation \(x - 2y = 4\), we can substitute each pair into the equation. - For A: \((-2, -3)\), substituting gives \(-2 - 2(-3) = -2 + 6 = 4\), which is correct. - For B: \((0, 2)\), substituting gives \(0 - 2(2) = 0 - 4 = -4\), which does not equal 4, making this option incorrect. - For C: \((4, 0)\), substituting gives \(4 - 2(0) = 4\), which is correct. - For D: \((8, 2)\), substituting gives \(8 - 2(2) = 8 - 4 = 4\), which is correct. Thus, option B is the only pair that does not satisfy the equation.
To determine which option is not a solution to the equation \(x - 2y = 4\), we can substitute each pair into the equation. - For A: \((-2, -3)\), substituting gives \(-2 - 2(-3) = -2 + 6 = 4\), which is correct. - For B: \((0, 2)\), substituting gives \(0 - 2(2) = 0 - 4 = -4\), which does not equal 4, making this option incorrect. - For C: \((4, 0)\), substituting gives \(4 - 2(0) = 4\), which is correct. - For D: \((8, 2)\), substituting gives \(8 - 2(2) = 8 - 4 = 4\), which is correct. Thus, option B is the only pair that does not satisfy the equation.