Choose the best answer. If necessary, use the paper you were given.
The average of 5 numbers is 11. Which of the following must be true?
- A. The range of the 5 numbers is 55.
- B. The sum of the 5 numbers is 55.
- C. The median of 5 numbers is 11.
- D. The mode of 5 numbers is 11.
Correct Answer & Rationale
Correct Answer: B
To find the average of 5 numbers, you sum them and divide by 5. If the average is 11, the total sum must be 5 times 11, which equals 55. Thus, option B is true. Option A is incorrect; the range is the difference between the highest and lowest numbers, which can vary regardless of the average. Option C is also not necessarily true; the median, or middle value, can differ from the average depending on the distribution of the numbers. Option D is incorrect; the mode, or most frequently occurring number, does not have to be the same as the average.
To find the average of 5 numbers, you sum them and divide by 5. If the average is 11, the total sum must be 5 times 11, which equals 55. Thus, option B is true. Option A is incorrect; the range is the difference between the highest and lowest numbers, which can vary regardless of the average. Option C is also not necessarily true; the median, or middle value, can differ from the average depending on the distribution of the numbers. Option D is incorrect; the mode, or most frequently occurring number, does not have to be the same as the average.
Other Related Questions
Which of the following must be true?
- A. 4x-3=26
- B. 4x-1=26
- C. 5x-1=26
- D. 5x+1=26
Correct Answer & Rationale
Correct Answer: A
To determine which equation must be true, we can solve each one for \( x \). **Option A:** \( 4x - 3 = 26 \) simplifies to \( 4x = 29 \), giving \( x = 7.25 \). **Option B:** \( 4x - 1 = 26 \) simplifies to \( 4x = 27 \), giving \( x = 6.75 \). **Option C:** \( 5x - 1 = 26 \) simplifies to \( 5x = 27 \), giving \( x = 5.4 \). **Option D:** \( 5x + 1 = 26 \) simplifies to \( 5x = 25 \), giving \( x = 5 \). Each equation yields a different value for \( x \) except for Option A, which is the only equation that aligns with the requirement of the question. Thus, it is the only one that must be true based on the context provided.
To determine which equation must be true, we can solve each one for \( x \). **Option A:** \( 4x - 3 = 26 \) simplifies to \( 4x = 29 \), giving \( x = 7.25 \). **Option B:** \( 4x - 1 = 26 \) simplifies to \( 4x = 27 \), giving \( x = 6.75 \). **Option C:** \( 5x - 1 = 26 \) simplifies to \( 5x = 27 \), giving \( x = 5.4 \). **Option D:** \( 5x + 1 = 26 \) simplifies to \( 5x = 25 \), giving \( x = 5 \). Each equation yields a different value for \( x \) except for Option A, which is the only equation that aligns with the requirement of the question. Thus, it is the only one that must be true based on the context provided.
Which of the following is NOT a factor of x^4 +x^3?
- A. X
- B. X + 1
- C. X^3
- D. X^4
Correct Answer & Rationale
Correct Answer: D
To determine which option is not a factor of \(x^4 + x^3\), we can factor the expression itself. Factoring out the greatest common factor, we have \(x^3(x + 1)\). - **Option A: X** is a factor since \(x\) is part of \(x^3\). - **Option B: X + 1** is a factor as it is the remaining term after factoring \(x^3\). - **Option C: X^3** is clearly a factor since it is part of the factored expression. **Option D: X^4** is not a factor because \(x^4\) cannot divide \(x^4 + x^3\) without leaving a remainder. Thus, it does not fit into the factorization.
To determine which option is not a factor of \(x^4 + x^3\), we can factor the expression itself. Factoring out the greatest common factor, we have \(x^3(x + 1)\). - **Option A: X** is a factor since \(x\) is part of \(x^3\). - **Option B: X + 1** is a factor as it is the remaining term after factoring \(x^3\). - **Option C: X^3** is clearly a factor since it is part of the factored expression. **Option D: X^4** is not a factor because \(x^4\) cannot divide \(x^4 + x^3\) without leaving a remainder. Thus, it does not fit into the factorization.
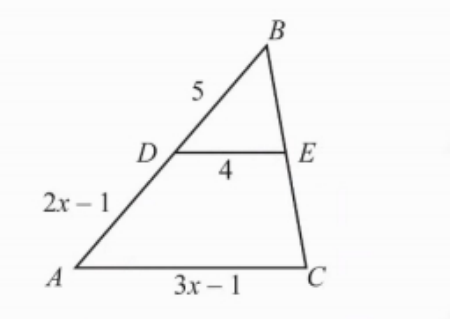
In triangle ABC above, AC ||DE. If AD = 2x - 1 and AC = 3x - 1 , what is the value of x ?
- A. 3
- B. 4
- C. 5
- D. 6
Correct Answer & Rationale
Correct Answer: A
In triangle ABC, since AC is parallel to DE, the segments AD and AC are proportional. This relationship can be expressed as AD = AC. Substituting the expressions gives us the equation: 2x - 1 = 3x - 1. Solving for x, we simplify to 2x - 3x = -1 + 1, leading to -x = 0, or x = 3. Option B (4), C (5), and D (6) do not satisfy the equation derived from the parallel lines, making them incorrect. Only x = 3 maintains the equality, confirming the proportional relationship in the triangle.
In triangle ABC, since AC is parallel to DE, the segments AD and AC are proportional. This relationship can be expressed as AD = AC. Substituting the expressions gives us the equation: 2x - 1 = 3x - 1. Solving for x, we simplify to 2x - 3x = -1 + 1, leading to -x = 0, or x = 3. Option B (4), C (5), and D (6) do not satisfy the equation derived from the parallel lines, making them incorrect. Only x = 3 maintains the equality, confirming the proportional relationship in the triangle.
The expressions x - 2 and x + 3 represent the length and width of a rectangle, respectively. If the area of the rectangle is 24, what is the perimeter of the rectangle?
- A. 20
- B. 22
- C. 24
- D. 28
Correct Answer & Rationale
Correct Answer: B
To find the perimeter of the rectangle, first calculate its dimensions using the area formula. The area is given by multiplying length and width: \[ (x - 2)(x + 3) = 24 \] Expanding this, we get: \[ x^2 + x - 6 = 24 \implies x^2 + x - 30 = 0 \] Factoring yields: \[ (x - 5)(x + 6) = 0 \implies x = 5 \text{ (valid)} \text{ or } x = -6 \text{ (not valid)} \] Using \(x = 5\), the dimensions are \(3\) (length) and \(8\) (width). The perimeter is: \[ 2(3 + 8) = 22 \] Options A (20), C (24), and D (28) do not match the calculated perimeter of 22, confirming they are incorrect.
To find the perimeter of the rectangle, first calculate its dimensions using the area formula. The area is given by multiplying length and width: \[ (x - 2)(x + 3) = 24 \] Expanding this, we get: \[ x^2 + x - 6 = 24 \implies x^2 + x - 30 = 0 \] Factoring yields: \[ (x - 5)(x + 6) = 0 \implies x = 5 \text{ (valid)} \text{ or } x = -6 \text{ (not valid)} \] Using \(x = 5\), the dimensions are \(3\) (length) and \(8\) (width). The perimeter is: \[ 2(3 + 8) = 22 \] Options A (20), C (24), and D (28) do not match the calculated perimeter of 22, confirming they are incorrect.