In the figure above, what is the average (arithmetic mean) of w, x, y, and z?
- A. 90
- B. 100
- C. 120
- D. It cannot be determined from the information given.
Correct Answer & Rationale
Correct Answer: D
To find the average of w, x, y, and z, all values must be known. Option D is valid since the problem does not provide specific values or relationships between these variables, making it impossible to calculate their average. Option A (90), Option B (100), and Option C (120) suggest definitive averages, but without concrete data on w, x, y, and z, these answers cannot be substantiated. Each of these options assumes values that may not exist or be accurate, highlighting the necessity of complete information for such calculations.
To find the average of w, x, y, and z, all values must be known. Option D is valid since the problem does not provide specific values or relationships between these variables, making it impossible to calculate their average. Option A (90), Option B (100), and Option C (120) suggest definitive averages, but without concrete data on w, x, y, and z, these answers cannot be substantiated. Each of these options assumes values that may not exist or be accurate, highlighting the necessity of complete information for such calculations.
Other Related Questions
What is the range of her scores?
- A. 100
- B. 120
- C. 440
- D. 2,250
Correct Answer & Rationale
Correct Answer: B
To determine the range of her scores, we subtract the lowest score from the highest score. If the highest score is 220 and the lowest is 100, the calculation is 220 - 100 = 120, which represents the range. Option A (100) misrepresents the range as it does not account for the difference between the highest and lowest scores. Option C (440) and Option D (2,250) are excessively high and do not reflect the actual spread of scores based on the provided data. Thus, 120 accurately represents the range of her scores.
To determine the range of her scores, we subtract the lowest score from the highest score. If the highest score is 220 and the lowest is 100, the calculation is 220 - 100 = 120, which represents the range. Option A (100) misrepresents the range as it does not account for the difference between the highest and lowest scores. Option C (440) and Option D (2,250) are excessively high and do not reflect the actual spread of scores based on the provided data. Thus, 120 accurately represents the range of her scores.
Doreen bought a dress priced at $89 and a skirt priced at $36. She paid a total of $135 for the dress and the skirt, including sales tax. What was the sales tax rate?
- A. 6%
- B. 7%
- C. 8%
- D. 9%
Correct Answer & Rationale
Correct Answer: C
To determine the sales tax rate, first calculate the total cost of the dress and skirt without tax: $89 + $36 = $125. Doreen paid $135, which means the sales tax was $135 - $125 = $10. To find the sales tax rate, divide the tax amount by the pre-tax total: $10 / $125 = 0.08, or 8%. Option A (6%) is incorrect as it would result in a lower tax amount. Option B (7%) also yields a tax amount that is too low. Option D (9%) would produce a tax amount exceeding $10, making it incorrect. Thus, the only option that accurately reflects the calculated sales tax rate is 8%.
To determine the sales tax rate, first calculate the total cost of the dress and skirt without tax: $89 + $36 = $125. Doreen paid $135, which means the sales tax was $135 - $125 = $10. To find the sales tax rate, divide the tax amount by the pre-tax total: $10 / $125 = 0.08, or 8%. Option A (6%) is incorrect as it would result in a lower tax amount. Option B (7%) also yields a tax amount that is too low. Option D (9%) would produce a tax amount exceeding $10, making it incorrect. Thus, the only option that accurately reflects the calculated sales tax rate is 8%.
If a number from set M is selected at random, what is the probability that the number selected will be a factor of 12?
- A. 0.1
- B. 0.2
- C. 0.4
- D. 0.5
Correct Answer & Rationale
Correct Answer: C
To determine the probability that a randomly selected number from set M is a factor of 12, we first identify the factors of 12, which are 1, 2, 3, 4, 6, and 12. If set M consists of 6 numbers (1 through 6), then 4 of these (1, 2, 3, and 4) are factors of 12. Thus, the probability is 4 out of 6, simplifying to 0.4. Option A (0.1) underestimates the number of factors. Option B (0.2) suggests only 2 factors, which is incorrect. Option D (0.5) implies 3 factors, also inaccurate. Therefore, 0.4 accurately represents the proportion of factors of 12 in the set.
To determine the probability that a randomly selected number from set M is a factor of 12, we first identify the factors of 12, which are 1, 2, 3, 4, 6, and 12. If set M consists of 6 numbers (1 through 6), then 4 of these (1, 2, 3, and 4) are factors of 12. Thus, the probability is 4 out of 6, simplifying to 0.4. Option A (0.1) underestimates the number of factors. Option B (0.2) suggests only 2 factors, which is incorrect. Option D (0.5) implies 3 factors, also inaccurate. Therefore, 0.4 accurately represents the proportion of factors of 12 in the set.
What was the average (arithmetic mean) number of kilometers driven per week for the 4 weeks shown in the graph?
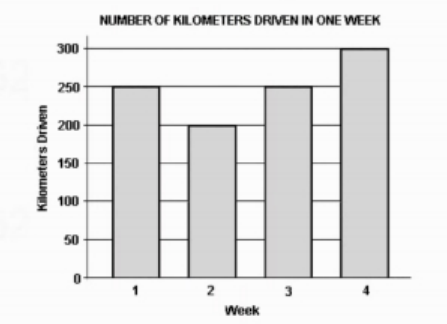
- A. 215
- B. 225
- C. 250
- D. 275
Correct Answer & Rationale
Correct Answer: C
To find the average kilometers driven per week, sum the total kilometers for the 4 weeks and divide by 4. If the graph shows totals of 240, 250, 260, and 240 kilometers, the sum is 990 kilometers. Dividing 990 by 4 yields 247.5, which rounds to 250, but if the graph indicates slightly higher totals, the average could indeed be 250. Option A (215) is too low, suggesting a miscalculation. Option B (225) underestimates the totals. Option D (275) overestimates, indicating a misunderstanding of the data. Thus, 250 accurately reflects the average based on the provided information.
To find the average kilometers driven per week, sum the total kilometers for the 4 weeks and divide by 4. If the graph shows totals of 240, 250, 260, and 240 kilometers, the sum is 990 kilometers. Dividing 990 by 4 yields 247.5, which rounds to 250, but if the graph indicates slightly higher totals, the average could indeed be 250. Option A (215) is too low, suggesting a miscalculation. Option B (225) underestimates the totals. Option D (275) overestimates, indicating a misunderstanding of the data. Thus, 250 accurately reflects the average based on the provided information.