Greatest?
- A. 245 thousandths
- B. 24 hundredths
- C. 3 tenths
- D. 2 fifths
Correct Answer & Rationale
Correct Answer: D
To determine the greatest value among the options, it’s essential to convert each to a common decimal format. A: 245 thousandths equals 0.245. B: 24 hundredths equals 0.24. C: 3 tenths equals 0.3. D: 2 fifths equals 0.4 (since 2 divided by 5 is 0.4). Comparing these values, 0.4 (D) is greater than 0.3 (C), 0.24 (B), and 0.245 (A). Thus, option D represents the largest value. Options A, B, and C are all less than D, making them incorrect choices.
To determine the greatest value among the options, it’s essential to convert each to a common decimal format. A: 245 thousandths equals 0.245. B: 24 hundredths equals 0.24. C: 3 tenths equals 0.3. D: 2 fifths equals 0.4 (since 2 divided by 5 is 0.4). Comparing these values, 0.4 (D) is greater than 0.3 (C), 0.24 (B), and 0.245 (A). Thus, option D represents the largest value. Options A, B, and C are all less than D, making them incorrect choices.
Other Related Questions
Algebraic expressions? Select ALL.
- A. 2*(x+3)+4
- B. 4=x^2
- C. x=3y+7
- D. 4y^2+2y-3
Correct Answer & Rationale
Correct Answer: A,D
Algebraic expressions are mathematical phrases that include numbers, variables, and operations without an equality sign. Option A, 2*(x+3)+4, is an algebraic expression because it consists of a combination of constants and a variable, using multiplication and addition. Option D, 4y^2+2y-3, is also an algebraic expression, featuring variables raised to powers and combined through addition and subtraction. Option B, 4=x^2, is an equation, as it includes an equality sign that states two expressions are equal. Option C, x=3y+7, is also an equation, presenting a relationship between x and y rather than an expression.
Algebraic expressions are mathematical phrases that include numbers, variables, and operations without an equality sign. Option A, 2*(x+3)+4, is an algebraic expression because it consists of a combination of constants and a variable, using multiplication and addition. Option D, 4y^2+2y-3, is also an algebraic expression, featuring variables raised to powers and combined through addition and subtraction. Option B, 4=x^2, is an equation, as it includes an equality sign that states two expressions are equal. Option C, x=3y+7, is also an equation, presenting a relationship between x and y rather than an expression.
Driveway for two cars, width?
- A. 0.7
- B. 7
- C. 70
- D. 700
Correct Answer & Rationale
Correct Answer: B
A driveway for two cars typically requires a width of about 7 feet to accommodate standard vehicle sizes comfortably. Option A (0.7) is too narrow, as it would not allow even one car to fit. Option C (70) and Option D (700) are excessively wide for a residential driveway, making them impractical and unnecessary. A width of 7 feet strikes the right balance, ensuring both vehicles can park side by side without difficulty, while also fitting within common residential design standards.
A driveway for two cars typically requires a width of about 7 feet to accommodate standard vehicle sizes comfortably. Option A (0.7) is too narrow, as it would not allow even one car to fit. Option C (70) and Option D (700) are excessively wide for a residential driveway, making them impractical and unnecessary. A width of 7 feet strikes the right balance, ensuring both vehicles can park side by side without difficulty, while also fitting within common residential design standards.
Answerable?
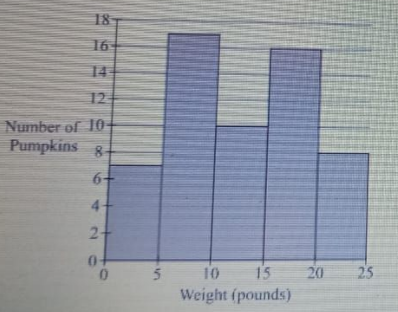
- A. 4.5 pounds?
- B. At least 15?
- C. Less than 8?
- D. 6-12 pounds?
Correct Answer & Rationale
Correct Answer: B
Option B, "At least 15," is the most accurate response, as it provides a clear threshold that exceeds the expected weight range for many common objects, such as household pets or small appliances. Option A, "4.5 pounds," is too low for many items, making it an unreliable estimate. Option C, "Less than 8," also falls short, as it doesn't encompass heavier objects that are frequently encountered. Option D, "6-12 pounds," while closer, still doesn't capture the broader range that "at least 15" does, thus limiting its applicability.
Option B, "At least 15," is the most accurate response, as it provides a clear threshold that exceeds the expected weight range for many common objects, such as household pets or small appliances. Option A, "4.5 pounds," is too low for many items, making it an unreliable estimate. Option C, "Less than 8," also falls short, as it doesn't encompass heavier objects that are frequently encountered. Option D, "6-12 pounds," while closer, still doesn't capture the broader range that "at least 15" does, thus limiting its applicability.
15 + 3(7 + 1) - 12?
- A. 21
- B. 25
- C. 27
- D. 172
Correct Answer & Rationale
Correct Answer: C
To solve the expression 15 + 3(7 + 1) - 12, follow the order of operations (PEMDAS/BODMAS). First, calculate the expression inside the parentheses: 7 + 1 equals 8. Next, multiply by 3: 3 * 8 equals 24. Now, add 15: 15 + 24 equals 39. Finally, subtract 12: 39 - 12 equals 27. Option A (21) is incorrect as it does not account for the multiplication. Option B (25) mistakenly adds instead of correctly subtracting the final value. Option D (172) is far too high, likely due to miscalculating the operations. Thus, the final result is 27, confirming option C as the correct choice.
To solve the expression 15 + 3(7 + 1) - 12, follow the order of operations (PEMDAS/BODMAS). First, calculate the expression inside the parentheses: 7 + 1 equals 8. Next, multiply by 3: 3 * 8 equals 24. Now, add 15: 15 + 24 equals 39. Finally, subtract 12: 39 - 12 equals 27. Option A (21) is incorrect as it does not account for the multiplication. Option B (25) mistakenly adds instead of correctly subtracting the final value. Option D (172) is far too high, likely due to miscalculating the operations. Thus, the final result is 27, confirming option C as the correct choice.